
At some point every enterprise SEO program gets pulled into a budget review, and somebody from finance (usually the person who has been quietly skimming past your ranking charts) leans back and asks what the company actually got for the money.
Most SEO teams answer that with traffic numbers, which is understandable because traffic is what the tools report, but it rarely goes down well with a CFO who thinks in gross profit, acquisition cost, payback and the present value of money that won’t arrive for another two or three years. An enterprise SEO ROI calculator is really a translation layer between those two worlds, and it only works if the translation is honest.
There’s an extra wrinkle in 2026. According to SparkToro’s study of Similarweb panel data, 68.01% of US Google searches in the first four months of the year ended without a single click, which means any model still using click-through curves from a few years back is going to promise more traffic than you’ll actually get (and finance tends to have a long memory for forecasts that missed).
This guide walks through the formulas, the inputs and a complete worked example with all of the arithmetic shown, then gets into adjusting for AI Overviews, setting everything up in a spreadsheet and presenting it on a single page. Toward the end I’ve also covered three related questions that tend to come up in the same searches: measuring ROI on internal enterprise search, how a software company’s pricing model changes the value of SEO, and how all of this ties into what an SEO company is worth.
What an Enterprise SEO ROI Calculator Actually Does
In the most basic sense, an ROI model weighs what organic search brings in against what it costs you. At enterprise scale it ends up doing three separate jobs, and it helps to be clear about which one you’re doing at any given moment:
- Measure: looking back at money already spent and the closed-won deals your CRM can trace to organic search.
- Forecast: looking ahead at the budget you want, using keyword demand, the rankings you can realistically win and your own funnel rates.
- Compare: putting organic side by side with paid search, events, outbound and anything else competing for the same budget line.
Most free tools only really handle the first job. A basic SEO ROI calculator also tends to count revenue instead of profit, which is fine if you run a small store with a single checkout, but it gets shaky fast once deals take nine months to close, contracts renew over several years, the brand runs fifteen domains and finance wants the time value of money built in.
| Feature | Basic SEO ROI calculator | Enterprise model |
|---|---|---|
| Return measured as | Revenue | Gross profit over the customer lifetime |
| Time frame | One period | Multiple years, discounted |
| Traffic assumption | One CTR curve by position | CTR split by AI Overview presence |
| Attribution | Last click | Closed-loop, brand and non-brand separated |
| Costs | Agency fee and tools | Fully loaded: people, dev, content, digital PR |
| Output | One ROI number | ROI range, CAC, LTV:CAC, payback, NPV |
The Formulas Your Model Needs (and Where Most Teams Slip)
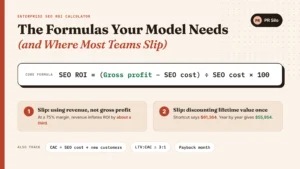
Every enterprise SEO ROI calculator that holds up in a finance review starts from this line:
SEO ROI = (Gross profit from organic customers − Total SEO cost) ÷ Total SEO cost × 100
The first term is gross profit, and that detail matters more than people expect. If your product runs at a 75% gross margin, each dollar of revenue is worth about 75 cents to the business, so plugging revenue into the formula inflates ROI by roughly a third, which is usually the first thing a sharp finance partner will spot.
You’ll also need a handful of supporting formulas:
- Customer acquisition cost (CAC) = Total SEO cost ÷ New customers from organic search
- Annual gross profit per customer = Annual contract value × Gross margin
- Discounted lifetime value (NPV of LTV): divide each year’s gross profit by (1 + discount rate) raised to that year’s number, then add the results together
- LTV:CAC ratio = NPV of LTV ÷ CAC; anything under about 3:1 usually means acquisition is costing too much
- Payback period: the month in which cumulative gross profit from organic customers catches up with cumulative SEO spend
There’s one shortcut I’d steer clear of, because it turns up in a lot of templates. It takes the whole lifetime value and divides it by (1 + discount rate) a single time, which only discounts the first year. Take a customer who brings in $22,500 of gross profit a year for three years at a 10% discount rate: the shortcut values them at $61,364, while discounting year by year gives $55,954. Spread that across 76 customers and you’ve added roughly $411,000 of value that was never really there.
Inputs: What to Gather and Who Owns Each Number
Costs: load everything
Cost is where most SEO ROI figures get flattering, usually by accident, since salaries live in one budget, developer time in another and the agency invoice tends to be the only number anyone remembers. It’s worth pulling every line in, even the awkward ones:
| Cost line | Usually supplied by | Often missed? |
|---|---|---|
| Share of in-house SEO and content salaries | Finance, HR | Yes |
| Agency and contractor retainers | Finance | No |
| Content production, design, expert review | Marketing | Partly |
| Developer hours for fixes and migrations | Engineering | Yes |
| Digital PR and link acquisition | Marketing | Sometimes |
| Tools for ranking, crawling and backlink data | Marketing ops | No |
| Reporting and analytics time | Analytics | Yes |
Demand: keywords and click-through rates
On the demand side you need the monthly search volume for the non-brand keywords you’re going after, a realistic view of where you’ll rank and how long that will take, and click-through rates split by whether Google shows an AI Overview on the results page. I’ll come back to that split later, because right now it changes the forecast more than any other input.
Funnel and customer economics
For the funnel, gather your visit-to-lead rate on organic landing pages, lead-to-SQL and SQL-to-closed-won rates, annual contract value (or average order value if you sell online), gross margin and average customer lifetime, which you can roughly estimate as 1 ÷ annual churn. The discount rate is worth asking finance for directly; most will simply use their cost of capital.
It also pays to settle ownership early. Marketing generally holds the traffic and lead data, sales ops owns the pipeline stages and win rates, and finance looks after cost, margin and the discount rate. Agree on definitions before anyone builds anything, because a “lead” in a marketing automation tool and a “lead” in the CRM are very often counted in different ways.
A Worked Example: From Keywords to Net Present Value
To make this concrete, I’ll run the full model for a hypothetical B2B software company, and you can swap your own numbers in as you go.
Program cost: $420,000 a year, made up of a $180,000 agency retainer, $120,000 of in-house salaries allocated to SEO, $60,000 for content, $36,000 for digital PR and link building, plus $12,000 each for tools and developer time.
- Demand. The non-brand keyword cluster the company is targeting adds up to 150,000 searches a month.
- Traffic. Once AI Overviews are accounted for (the math is in the next section), blended CTR at the expected positions comes out at 3%, or about 4,500 visits a month when the program is at full speed.
- Leads. With a 1.5% visit-to-lead rate, that turns into roughly 67 leads a month.
- Pipeline. About 30% of those leads become SQLs, so around 20 a month, and 15% of SQLs close, which works out to about 3 new customers a month or 36 a year at full ramp.
- Customer value. Contracts average $30,000 a year at a 75% gross margin, giving $22,500 of gross profit per customer per year; customers stay three years, and discounted at 10% each one is worth $55,954 today.
- Ramp. Since no SEO program hits full volume in its first month, the model assumes 30% of full volume in year one, 80% in year two and 100% in year three.
| Metric | Year 1 | Year 2 | Year 3 | Three-year total |
|---|---|---|---|---|
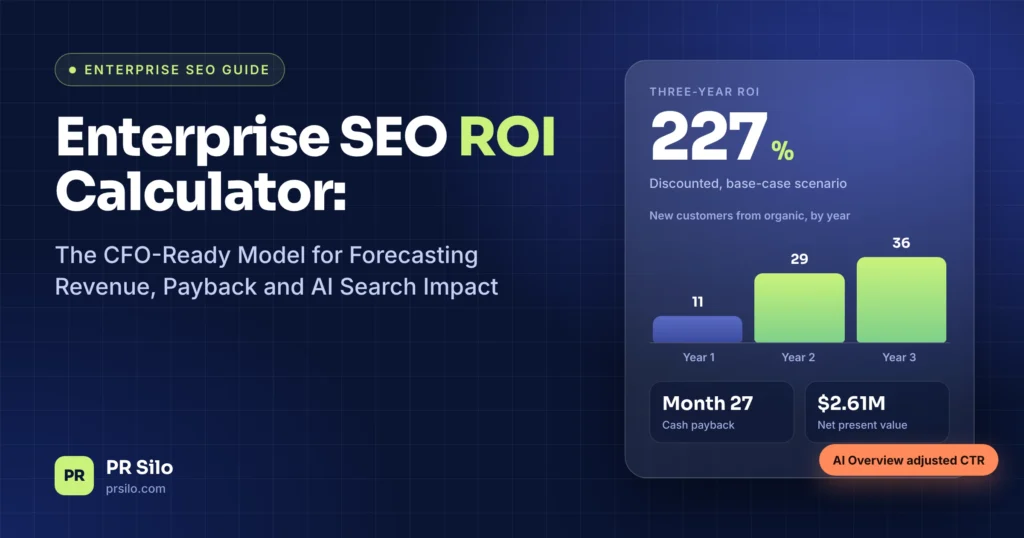
| New customers | 11 | 29 | 36 | 76 |
| SEO cost | $420,000 | $420,000 | $420,000 | $1,260,000 |
| CAC | $38,182 | $14,483 | $11,667 | $16,579 |
| LTV:CAC | 1.5:1 | 3.9:1 | 4.8:1 | 3.4:1 |
Discounted back to today, the three yearly cohorts of customers are worth about $3.76 million, set against roughly $1.15 million of discounted cost, which gives a net present value of around $2.61 million and a three-year ROI of about 227%.
Year one tells a very different story when you look at it on its own. Only 11 customers sign, and most of their gross profit lands in later years, so on a cash basis the first year shows a loss and payback doesn’t arrive until somewhere around month 27. In my view this is the most common reason enterprise SEO budgets get cut, since a program built to pay off over 36 months ends up being judged at month 12. If you count full contract value at signing instead of cash received, payback shows up much earlier, so it’s worth telling finance which method you’ve used before anyone has to ask.
Adjusting Your SEO ROI Forecast for AI Overviews

Classic CTR curves were built for a results page with ten blue links on it, and that’s no longer what most buyers see when they search. If your enterprise SEO ROI calculator still applies one curve to every keyword, there’s a good chance it’s overstating informational traffic.
Three studies are worth keeping open while you build this part of the model. Ahrefs analyzed 300,000 keywords and found that, by December 2025, the presence of an AI Overview was tied to a 58% lower click-through rate for the top-ranking page. Pew Research Center tracked the actual browsing of 900 US adults and saw people click a traditional result on 8% of visits when an AI summary appeared, against 15% when there wasn’t one. And Seer Interactive’s 2026 study of 53 brands found AI Overviews on 36% of informational queries but only 8% of commercial and 5% of transactional ones; somewhat surprisingly, organic CTR on AI Overview queries in that data recovered from 1.3% in December 2025 to 2.4% by February 2026.
So how exposed you are depends mostly on your keyword mix. The way I’d build that into an SEO ROI forecast is fairly simple:
- Pull SERP features for every target keyword from your rank tracker and tag each one according to whether an AI Overview shows up.
- Give each group its own CTR curve, built from your Search Console data wherever possible (Seer’s own conclusion was that industry-wide averages tend to mislead and that first-party data should lead the model).
- Add a citation scenario, since Seer also found that brands cited inside an AI Overview earned about 120% more organic clicks per impression than uncited brands on the same queries.
Going back to the example, 90,000 of the 150,000 monthly searches don’t trigger an AI Overview and click through at 4%, while the other 60,000 do, the brand isn’t cited and CTR falls to 1.5%. Adding the resulting 3,600 and 900 visits together is where the blended 3% came from. If the brand then starts earning citations on those 60,000 searches and lifts that segment’s CTR to 3.3%, monthly visits rise to 5,580, which is 24% more traffic from exactly the same rankings.
That 24% is a useful number to have ready when someone asks whether AI search optimization deserves its own line in the budget. It also changes how you should think about authority, because AI Overviews, ChatGPT and Perplexity tend to draw on pages that already rank well and that credible publications mention, and that’s precisely the kind of footprint a digital PR campaign is meant to build.
I’d also track AI visibility on a separate scorecard, covering citation counts, share of voice in AI answers for your priority prompts, branded search lift and the number of buyers who tell sales an AI assistant pointed them your way. Very little of that ever turns into a GA4 session, so a traffic-only model will simply miss it.
SEO ROI Forecasting: Conservative, Base and Aggressive Scenarios
A single forecast number tends to turn the meeting into a debate about that number, whereas three scenarios move the conversation toward which level of investment makes sense. That’s the main reason good SEO ROI forecasting is presented as a range, with the assumptions behind each scenario written out next to it.
All three scenarios below use the worked example’s $420,000 annual cost, $30,000 contract value, 75% margin, three-year customer life and 10% discount rate.
| Assumption or result | Conservative | Base | Aggressive |
|---|---|---|---|
| Blended CTR | 2.2% | 3.0% | 3.8% |
| Visit-to-lead rate | 1.2% | 1.5% | 1.8% |
| Lead-to-SQL rate | 25% | 30% | 35% |
| SQL-to-won rate | 12% | 15% | 18% |
| Ramp in years 1, 2 and 3 | 20%, 65%, 90% | 30%, 80%, 100% | 40%, 90%, 100% |
| New customers over three years | 25 | 76 | 179 |
| Three-year discounted ROI | 7% | 227% | 675% |
| Cash payback | Month 51 | Month 27 | Month 14 |
The gap between the columns is bigger than most people expect. None of the aggressive inputs looks unrealistic on its own, yet together they produce seven times as many customers as the conservative case, because the funnel rates multiply each other. One consequence that’s easy to miss is that a 10% change in CTR moves customer volume by exactly the same amount as a 10% change in win rate, so the more useful question is which input you’re least confident in. At the moment that’s usually CTR, given how much AI Overviews have shaken things up, which makes it the first place to spend validation effort.
For a sanity check, published benchmarks help. First Page Sage reports, from campaigns run between Q1 2021 and Q3 2025, a three-year average ROI of 702% for B2B SaaS with break-even at 7 months, plus 813% for manufacturing and 1,031% for financial services, both of which break even at 9 months. Their data also shows how much the type of program matters, with technical-only SEO averaging 117% and basic content programs only 16%. Because these figures come from a single agency’s client base, I’d use them as an upper reference point instead of something to plan around, and if your base case comes out well above them it’s worth rechecking the inputs before finance does.
How to Build an SEO ROI Calculator in Excel or Google Sheets
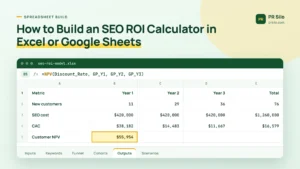
Most people looking for an SEO ROI calculator Excel template want something they can hand to finance and let them test. I’d still recommend building your own instead of downloading one, mainly because finance tends to trust formulas it can trace cell by cell, and you don’t need anything fancy for that; a well-organized spreadsheet makes a perfectly workable enterprise SEO ROI calculator.
| Tab | What goes in it |
|---|---|
| Inputs | Every assumption in one place, color-coded, with a source note beside each |
| Keywords | Keyword, volume, current position, target position, AI Overview flag, CTR applied, expected visits |
| Funnel | Visits by ramp month, leads, SQLs, customers |
| Cohorts | One row per acquisition year, gross profit by year across the customer lifetime |
| Outputs | ROI, NPV, CAC, LTV:CAC, payback month |
| Scenarios | Conservative, base and aggressive input sets |
These are the formulas that end up doing most of the heavy lifting:
- Expected visits per keyword:
=Volume * IF(AIO_Flag="Yes", CTR_AIO, CTR_NoAIO) - Customer NPV:
=NPV(Discount_Rate, GP_Y1, GP_Y2, GP_Y3), where each GP cell holds one year of gross profit - Discounted program cost:
=Cost_Y1 + NPV(Discount_Rate, Cost_Y2, Cost_Y3), which treats year-one spend as money going out today - Payback month: a running column of cumulative gross profit minus cumulative spend, followed by
=MATCH(TRUE, INDEX(Cumulative_Net>=0, 0), 0) - Sensitivity: Excel’s Data Table under What-If Analysis, or in Google Sheets a simple two-way grid with CTR down one side and win rate across the top
Named ranges make a big difference here, since they let the formulas read almost like plain English when finance goes through them. An SEO ROI calculator Excel file laid out this way also scales well; once manual updates start to feel tedious, the same structure moves into Looker Studio and can pull live data from Search Console, GA4 and your CRM.
Measuring Results After Launch: Attribution That Survives a Finance Review
The forecast is what wins the budget, but measurement is what keeps it. Proving enterprise SEO ROI once the program is live usually comes down to a few deliberate pieces of setup.
Closed-loop tracking comes first. Hidden form fields can capture the original source and landing page and pass them into your CRM (Salesforce, HubSpot or whatever you use), so that a closed-won deal still carries a record of where it started; GA4 on its own won’t connect a deal that closes nine months later.
Self-reported attribution fills in a lot of the remaining gaps. Making “how did you hear about us” a required field picks up AI assistant recommendations, podcasts and word of mouth, none of which shows up in analytics.
Brand and non-brand traffic should be reported separately. Branded searches mostly reflect demand that other channels created, so while they belong in the report, SEO deserves credit mainly for non-brand growth and for protecting your branded results.
Pick one attribution model with finance and stay with it, whether that’s first touch, position-based or data-driven, because switching models partway through the year breaks every trend line you’re trying to show.
Incrementality checks are worth running where you can: change a group of similar pages, leave a matched group alone as a control and compare the two over a few months. It’s about the closest SEO gets to a controlled experiment.
Finally, paid-equivalent value (what those non-brand clicks would cost in Google Ads) is useful context, but since it isn’t revenue it shouldn’t go anywhere near the ROI numerator.
Each quarter, feed actual conversion and win rates back into the enterprise SEO ROI calculator. After three or four quarters the forecast is running on your own history instead of assumptions, and that tends to be about when finance stops pushing back on it.
How to Measure the ROI of Enterprise Search
This phrase gets used for two quite different things, which can be confusing if you land on it from a search.
One is organic search for a large brand, which is what everything above covers. The other is enterprise search software, meaning the search box on your intranet, knowledge base, help center or inside your product. If you’re trying to work out how to measure the ROI of enterprise search in that second sense, the logic shifts away from acquisition and toward efficiency, and the main components usually look something like this:
- Time saved: minutes saved per search × searches per employee per week × employees × loaded hourly cost × working weeks
- Support deflection: help center searches that end without a ticket × the cost of handling a ticket
- Site search revenue: the conversion gap between visitors who use on-site search and those who don’t, applied to search volume
- Cost: licenses, implementation, content tagging and the ongoing work of tuning relevance
As a rough example, saving 2 minutes on each of 20 weekly searches for 1,000 employees at a $60 loaded hourly cost, across 46 working weeks, comes to about $1.84 million a year.
Whichever meaning you’re working with, how to measure the ROI of enterprise search really starts with naming the business outcome you care about, and only after that choosing the metric.
Using an Enterprise Software Monetization ROI Calculator With Your SEO Model
Software companies have an extra variable that most SEO models leave out entirely, which is what happens to revenue after the first sale. Seat-based, usage-based and tiered pricing all change lifetime value, and for a lot of SaaS businesses expansion revenue ends up larger than the original contract.
If your pricing or finance team already maintains an enterprise software monetization ROI calculator, its outputs can go straight into the SEO model: starting contract value by plan or segment, net revenue retention (so lifetime value includes upsell and expansion as well as renewals), and gross margin by tier, since usage-heavy plans often carry higher infrastructure costs.
Imagine a customer who starts at $30,000 and expands 15% a year. Over three years they’re worth about 15% more than the flat customer in the worked example, $64,195 compared with $55,954 in today’s money, and that difference can change which keywords deserve investment. Running an enterprise software monetization ROI calculator for each customer segment lets you rank keyword clusters by the kind of customer they attract, instead of by search volume alone.
SEO ROI and Company Value: The Valuation Calculation for SEO Company Owners
ROI doesn’t stay inside the marketing budget forever; sooner or later it shows up in what the business is worth.
For most companies the link is indirect: an organic channel that lowers blended acquisition cost improves margins, and buyers pay a multiple of earnings. For agencies it’s a lot more direct. A valuation calculation for SEO company owners normally starts with adjusted EBITDA multiplied by a market multiple, and FE International puts most digital marketing agencies at 3x to 7x adjusted EBITDA in 2026, with strategic outliers reaching 8x to 12x and smaller owner-run agencies selling at around 2x to 4x seller’s discretionary earnings. The factors they say move the multiple include retainer revenue above 60% of the mix, EBITDA margins above 20%, low dependence on any single client and strong retention.
Client ROI reporting feeds into almost all of those. Clients who can clearly see revenue coming back from SEO are more likely to renew, and recurring renewals are a big part of what acquirers are paying for, so the model that justifies a client’s budget today can end up as supporting evidence in any valuation calculation for SEO company buyers carry out during due diligence.
Seven Mistakes That Make SEO ROI Numbers Fall Apart
- Using revenue in place of gross profit, which inflates ROI by however large your margin gap is.
- Judging the program at month 12, when multi-year contracts mean year-one cash ROI is usually negative even for programs that are working well.
- Treating branded traffic as an SEO win instead of reporting it in its own bucket.
- Relying on CTR curves from before AI Overviews, which tends to push informational traffic forecasts too high.
- Forgetting internal costs such as developer hours and the content team’s time.
- Giving SEO all of the credit or none of it, since crediting it with every deal that ever touched the blog is just as misleading as crediting it with nothing.
- Presenting a single number with no range, which reads like a promise, and missed promises tend to cost budgets.
How to Present Enterprise SEO ROI to a CFO
Ideally, whatever your enterprise SEO ROI calculator produces should fit on one page. In practice that page usually covers:
- the three-year ROI range, with the base case marked
- the payback month, along with whether it’s measured on cash or on bookings
- organic CAC and LTV:CAC next to the same figures for paid search and events
- the three assumptions the result depends on most, and how you plan to validate each of them
- the leading indicators you’ll report every month, so nobody has to wait a year for an update
On reporting rhythm, I’d send rankings, AI citations, traffic and leads monthly, SQLs and pipeline quarterly, and ROI along with the next forecast once a year. Executives generally want the overall direction, marketing wants channel-level detail and finance wants cost lines and attribution rules written down, so it helps to give each group its own view of the same underlying data.
Where Digital PR and Link Building Fit in the Model
Authority work tends to get filed under cost and almost never modeled as something that drives results, which undersells it. It directly affects two inputs: how quickly pages reach their target positions (the ramp) and whether AI systems cite you (the AI Overview CTR segment). In the worked example, earning citations added 24% more visits without any change in rankings at all.
So it’s worth modeling on purpose. Budget for high-authority guest posts and earned media as their own line item, tie each campaign to the keyword cluster it’s supposed to support, and then compare ramp speed and citation rates for supported clusters against clusters that didn’t get that support. After two or three quarters you’ll have your own evidence of how much authority shortens time to rank. If you’d rather have someone run and report on that work for you, PR Silo’s off-page SEO services tie every campaign back to rankings and revenue.
The Bottom Line
An enterprise SEO ROI calculator is only as believable as the weakest assumption inside it. If you use gross profit, discount each year properly, split CTR by whether an AI Overview appears, show three scenarios and agree on attribution with finance before the first report goes out, the conversation tends to move from “what did we get?” toward “how much more should we put in?”
If you’d like help building the model or running the program behind it, talk to the PR Silo team about a complete SEO strategy with ROI reporting built in from the first month.
Frequently Asked Questions
Q1. How Do You Calculate Enterprise SEO ROI?
You take the gross profit generated by customers who came through organic search, subtract the total cost of your SEO program, divide the result by that cost and multiply by 100. For enterprise accounts it’s worth measuring that gross profit over the full customer lifetime and discounting each year back to today, since a three-year contract signed this quarter isn’t worth its full value yet. I’d also track CAC and LTV:CAC alongside ROI, because together they show efficiency as well as return.
Q2. What is a Good Enterprise SEO ROI?
There isn’t a universal figure, because contract length, margins and competition vary so widely from one business to the next. As a rough working rule for B2B, a program that reaches a positive discounted ROI within three years and an LTV:CAC ratio of at least 3:1 at full ramp is doing well. Published benchmarks are often much higher (First Page Sage reports a 702% three-year average for B2B SaaS), though those numbers come from one agency’s own client base.
Q3. How Long Does Enterprise SEO Take to Pay Back?
It depends a lot on how you count. First Page Sage’s industry data puts break-even anywhere between 5 and 14 months depending on the sector, but on a pure cash basis, companies with multi-year contracts often wait longer; the worked example above only reaches cash payback around month 27, even though its three-year ROI is strong. Whichever method you use, state it clearly so nobody ends up comparing a cash figure with a booked one.
Q4. What Costs Belong in an SEO ROI Calculation?
Pretty much all of them, including agency and contractor fees, the share of in-house salaries that goes to SEO and content, content production and design, developer time for technical work, digital PR and link building, tools, and the hours spent on analytics and reporting. Internal time is the item most often left out, and leaving it out makes ROI look better than it really is until someone audits the numbers.
Q5. How Do You Measure SEO ROI When Attribution is Messy?
Start simple and tighten things up over time. Hidden form fields can record first-touch source and landing page in the CRM, a required “how did you hear about us” question catches what analytics misses, and branded and non-branded traffic should be kept apart from the beginning. Once the data is reasonably clean, agree on a multi-touch model with finance and stick with it, because switching models halfway through a year makes your trends very hard to read.
Q6. Should Branded Search Count Toward SEO ROI?
It’s worth reporting, but I wouldn’t build the case on it. Most branded searches come from demand that sales, PR, advertising or word of mouth created, so crediting all of it to SEO overstates what the channel did. A fairer approach gives SEO credit for non-brand growth and for protecting branded results, such as holding page one and making sure AI answers about your company are accurate.
Q7. How Do You Prove SEO ROI to a CFO or board?
Keep it to one page with a three-year ROI range and base case, the payback month and how it was calculated, organic CAC compared with paid search and events, the assumptions the result relies on most, and the leading indicators you’ll report each month. Finance teams generally respond far better to a range with a stated method and a channel comparison than to one impressive-looking number.
Q8. How Accurate is An SEO ROI Forecast?
Less accurate than a paid media forecast, and it’s better to say so up front. In Seer Interactive’s 2026 research, their model predicted paid CTR to within 0.09 percentage points but missed organic CTR by 0.6 to 2.6 points. Good SEO ROI forecasting therefore treats organic as a range, compares actuals with the forecast every quarter and replaces assumptions with real data as it comes in, and accuracy usually improves noticeably after three or four quarters.
Q9. Is an SEO ROI Calculator Excel Template Good Enough for Enterprise Use?
Yes, as long as it’s structured properly. A spreadsheet with separate tabs for inputs, keywords, funnel, cohorts, outputs and scenarios is transparent, easy for finance to audit and flexible enough for sensitivity testing, and for plenty of teams it’s the only enterprise SEO ROI calculator they ever need. When you want live data from Search Console, GA4 and your CRM, moving to something like Looker Studio makes sense, as long as the underlying logic stays the same.
Q10. How Do AI Overviews Change SEO ROI?
They reduce click-through rates on the queries where they appear, which are mostly informational. Ahrefs measured a 58% lower CTR for the top result when an AI Overview was present, and Seer found AI Overviews on 36% of informational queries compared with just 5% of transactional ones. The practical response is to model those keywords separately and add a citation scenario, since in Seer’s data brands cited inside an AI Overview earned about 120% more clicks per impression than brands that weren’t cited.